# Post mortem: 2024-05-25
For reference you can see a bit of the organization of my sites in this same blog.
At 4am evilmeow.com and all my sites (including this log started alerting)
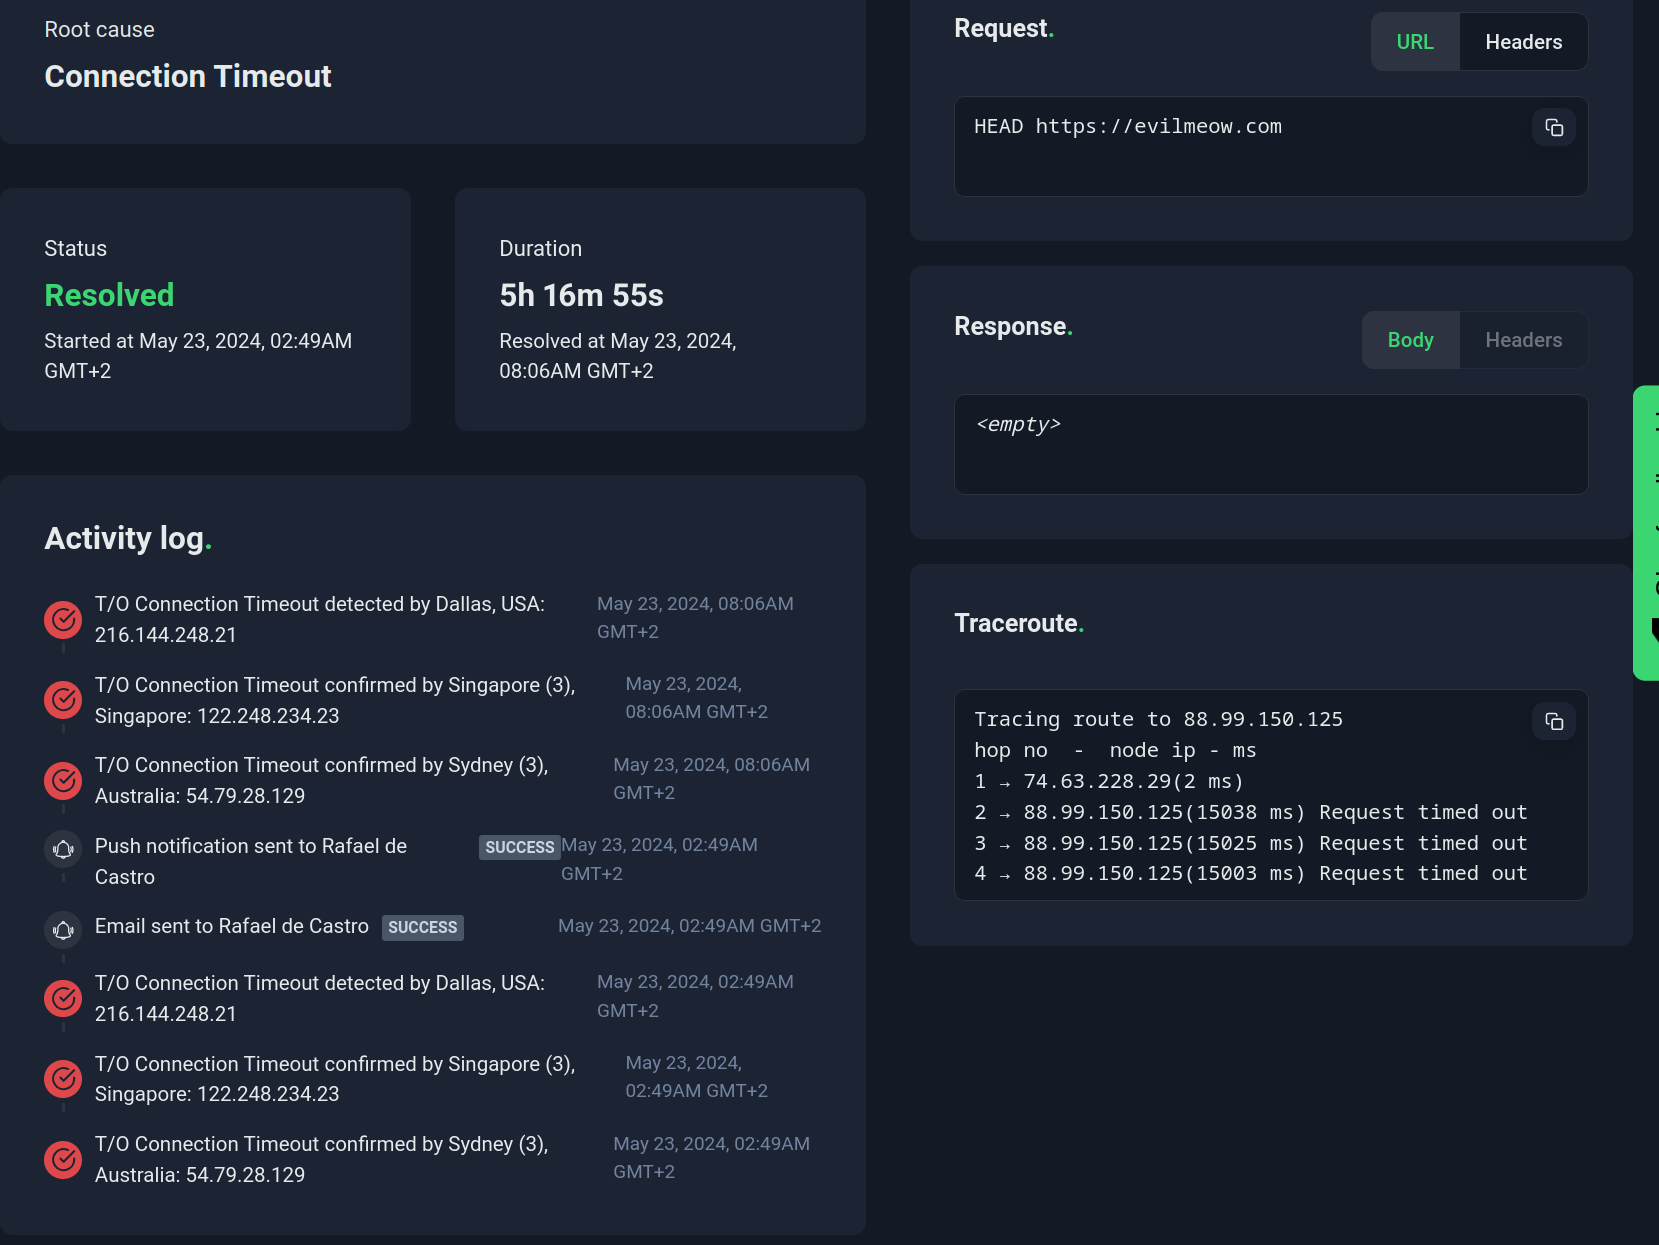
Ping failing so let's see.
A restart "fixed" the problem for a couple of minutes and then it got down again.
The logs for some reason were not being sent to Loki. So we redirected dmesg to a file. Checking that file we saw the error message:
> [170902.115198] watchdog: BUG: soft lockup - CPU#0 stuck for 7342s! [CPU
> 1/KVM:1382]
>
> [170986.118899]  ? __hrtimer_run_queues+0x105/0x280
> [170986.118986]  ? clockevents_program_event+0xb3/0x140
> [170986.119112]  ? hrtimer_interrupt+0xf6/0x250
> [170986.119199]  ? __sysvec_apic_timer_interrupt+0x4e/0x150
> [170986.119288]  ? sysvec_apic_timer_interrupt+0x8d/0xd0
> [170986.119378]  </IRQ>
> [170986.119460]  <TASK>
> [170986.119543]  ? asm_sysvec_apic_timer_interrupt+0x1b/0x20
> [170986.119634]  ? smp_call_function_single+0x11e/0x160
> [170986.119727]  ? __pfx___loaded_vmcs_clear+0x10/0x10 [kvm_intel]
> [170986.119840]  ? update_load_avg+0x82/0x830
> [170986.119928]  vmx_vcpu_load_vmcs+0x143/0x440 [kvm_intel]
> [170986.120037]  vmx_vcpu_load+0x19/0x60 [kvm_intel]
> [170986.120145]  kvm_arch_vcpu_load+0x48/0x240 [kvm]
> [170986.120320]  ? load_fixmap_gdt+0x44/0x80
> [170986.120407]  ? __perf_event_task_sched_in+0x88/0x200
> [170986.120497]  kvm_sched_in+0x3a/0x50 [kvm]
> [170986.120649]  finish_task_switch.isra.0+0x212/0x310
> [170986.120738]  __schedule+0x409/0x15e0
> [170986.120825]  schedule+0x33/0x110
> [170986.120910]  kvm_vcpu_block+0x58/0xc0 [kvm]
> [170986.121094]  kvm_vcpu_halt+0xde/0x460 [kvm]
> [170986.121246]  kvm_arch_vcpu_ioctl_run+0xab4/0x1760 [kvm]
> [170986.121409]  kvm_vcpu_ioctl+0x297/0x800 [kvm]
> [170986.121591]  ? kvm_on_user_return+0x78/0xd0 [kvm]
> [170986.121749]  ? fire_user_return_notifiers+0x37/0x80
> [170986.121842]  ? syscall_exit_to_user_mode+0x86/0x260
> [170986.121931]  __x64_sys_ioctl+0xa0/0xf0
> [170986.122023]  x64_sys_call+0xa68/0x24b0
> [170986.122132]  do_syscall_64+0x81/0x170
> [170986.122241]  ? do_syscall_64+0x8d/0x170
> [170986.122328]  ? do_syscall_64+0x8d/0x170
> [170986.122414]  ? do_syscall_64+0x8d/0x170
> [170986.122500]  ? do_syscall_64+0x8d/0x170
> [170986.122586]  ? do_syscall_64+0x8d/0x170
> [170986.122673]  entry_SYSCALL_64_after_hwframe+0x78/0x80
> [170986.122761] RIP: 0033:0x78d9dcb1cc5b
> [170986.122866] Code: 00 48 89 44 24 18 31 c0 48 8d 44 24 60 c7 04 24 10 00 00 00
> 48 89 44 24 08 48 8d 44 24 20 48 89 44 24 10 b8 10 00 00 00 0f 05 <89> c2 3d 00 f0
> ff ff 77 1c 48 8b 44 24 18 64 48 2b 04 25 28 00 00
> [170986.123004] RSP: 002b:000078d9ca3fb0b0 EFLAGS: 00000246 ORIG_RAX:
> 0000000000000010
> [170986.123109] RAX: ffffffffffffffda RBX: 000058fa7d6bf4a0 RCX: 000078d9dcb1cc5b
> [170986.123213] RDX: 0000000000000000 RSI: 000000000000ae80 RDI: 000000000000001d
> [170986.123318] RBP: 000000000000ae80 R08: 000058fa7b0f2c90 R09: 0000000000000000
> [170986.123422] R10: 0000000000000002 R11: 0000000000000246 R12: 0000000000000000
> [170986.123526] R13: 0000000000000001 R14: 0000000000000001 R15: 0000000000000000
> [170986.123633]  </TASK>
> [171000.004671] rcu: INFO: rcu_preempt detected stalls on CPUs/tasks:
> [171000.004778] rcu:  7-...0: (0 ticks this GP) idle=1224/1/0x4000000000000000
> softirq=2170915/2170915 fqs=3901860
> [171000.004894] rcu:          hardirqs   softirqs   csw/system
> [171000.004982] rcu:  number:        0          0            0
> [171000.005072] rcu:  cputime:        0          0            0   ==> 7950223(ms)
> [171000.005176] rcu:  (detected by 0, t=7980227 jiffies, g=5655105, q=231104
> ncpus=8)
> [171000.005283] Sending NMI from CPU 0 to CPUs 7:
> [171000.005373] NMI backtrace for cpu 7
> [171000.005375] CPU: 7 PID: 391169 Comm: kworker/7:0 Tainted: G      D W I  L
> 6.8.4-3-pve #1
> [171000.005376] Hardware name: FUJITSU D3417-B1/D3417-B1, BIOS V5.0.0.11
> R1.29.0.SR.1 for D3417-B1x               05/13/2020
> [171000.005378] Workqueue: md submit_flushes
> [171000.005383] RIP: 0010:native_queued_spin_lock_slowpath+0x7f/0x2d0
> [171000.005386] Code: 00 00 f0 0f ba 2b 08 0f 92 c2 8b 03 0f b6 d2 c1 e2 08 30 e4
> 09 d0 3d ff 00 00 00 77 5f 85 c0 74 10 0f b6 03 84 c0 74 09 f3 90 <0f> b6 03 84 c0
> 75 f7 b8 01 00 00 00 66 89 03 5b 41 5c 41 5d 41 5e
After reaching Hetzner support looks like there is a hardware failure and they will proceed to replace the full machine.
They provide access to the new machine and I proceed to restoring latest backup from Proxmox Backup Server.
I started with OPNSense. Backup was restored in 5 mins but the machine did not start.
The interface vmbr1 was off. I lost 1h debugging that. By default
Debian's installation of Proxmox does not include the package
openvswitch-switch and looks like I installed it manually
and forgot to add it to the automations 🤦♂️.
Once the interface was in place everything started smooth as butter.… until 4 hours later.
The machine started failing again with a different dmesg error
> [31719.674017] BUG: kernel NULL pointer dereference, address: 0000000000000008
> [31719.674118] #PF: supervisor write access in kernel mode
> [31719.674197] #PF: error_code(0x0002) - not-present page
> [31719.674305] PGD 0 P4D 0
> [31719.674381] Oops: 0002 [#1] PREEMPT SMP PTI
> [31719.674460] CPU: 0 PID: 1180 Comm: kvm Tainted: G          I        6.8.4-3-pve
> #1
> [31719.674568] Hardware name: FUJITSU D3417-B1/D3417-B1, BIOS V5.0.0.11
> R1.29.0.SR.1 for D3417-B1x               05/13/2020
> [31719.674669] RIP: 0010:blk_flush_complete_seq+0x291/0x2d0
> [31719.674775] Code: 0f b6 f6 49 8d 56 01 49 c1 e6 04 4d 01 ee 48 c1 e2 04 49 8b
> 4e 10 4c 01 ea 48 39 ca 74 2b 48 8b 4b 50 48 8b 7b 48 48 8d 73 48 <48> 89 4f 08 48
> 89 39 49 8b 4e 18 49 89 76 18 48 89 53 48 48 89 4b
> [31719.674904] RSP: 0018:ffffaea0c936ba60 EFLAGS: 00010046
> [31719.674984] RAX: 0000000000000000 RBX: ffff9808d4040a00 RCX: ffff9808d4040a48
> [31719.675067] RDX: ffff9808d202b420 RSI: ffff9808d4040a48 RDI: 0000000000000000
> [31719.675149] RBP: ffffaea0c936baa0 R08: 0000000000000000 R09: 0000000000000000
> [31719.675231] R10: 0000000000000000 R11: 0000000000000000 R12: 0000000000029801
> [31719.675366] R13: ffff9808d202b400 R14: ffff9808d202b410 R15: ffff9808d3e97300
> [31719.675449] FS:  000073172a4006c0(0000) GS:ffff9817ae200000(0000)
> knlGS:0000000000000000
> [31719.675546] CS:  0010 DS: 0000 ES: 0000 CR0: 0000000080050033
> [31719.675626] CR2: 0000000000000008 CR3: 000000010af80002 CR4: 00000000003726f0
> [31719.675708] Call Trace:
> [31719.675808]  <TASK>
This time anyway it looks like it is not a hardware issue accorting to Hetzner support. I rolled back the kernel to a previous version and it has been running flawlessly for a day.
Takeaways
- Every small thing you don't automate bites you in the ass. Even if it is just installing a package
- I am a bit concerned on the stability on the kernel in Hetzner machines. I will keep two of them installed in case I have to roll back.
- Having decent logging aggregation saved me again.
So, some more learnings in exchange for some downtime. Anyway I am relatively happy now and sure that in the case of catastrophic event I won't lose all the data. Another step in the path to making evilmeow.com open to the public.